

Aruba Service Assurance Sensor Review
I ve been testing the Re-branded Sensor for a while now since HPE acquired Cape Networks and i must say that it still has the same look and feel as I was used to before the acquisition. They even added some nice extra features like Reporting, Telnet & VoIP testing and Disabling SSL validation for webserver tests.
So, what exactly is it? It’s a Wi-Fi device that mimics a client and tests/monitors overall performance metrics and runs tests like ping, iperf, zap, …. For your internal network and also external networks, for example testing the throughput of your end-to-end connection when downloading a YouTube video, more on this later.
I like the look and feel of this device, very slick sensor design and dashboard. Also, so easy to set-up and maintain. More details can be found here.
For my testing, is used a simple network design, with 1 sensor, 1 AP and 1 home gateway for DHCP and routing towards the internet. I also used the WLAN Pros’ ODROID-C2 WLAN_Pro Build v1.5 (Jerry Olla) and a Windows 7 laptop running a telnet server.
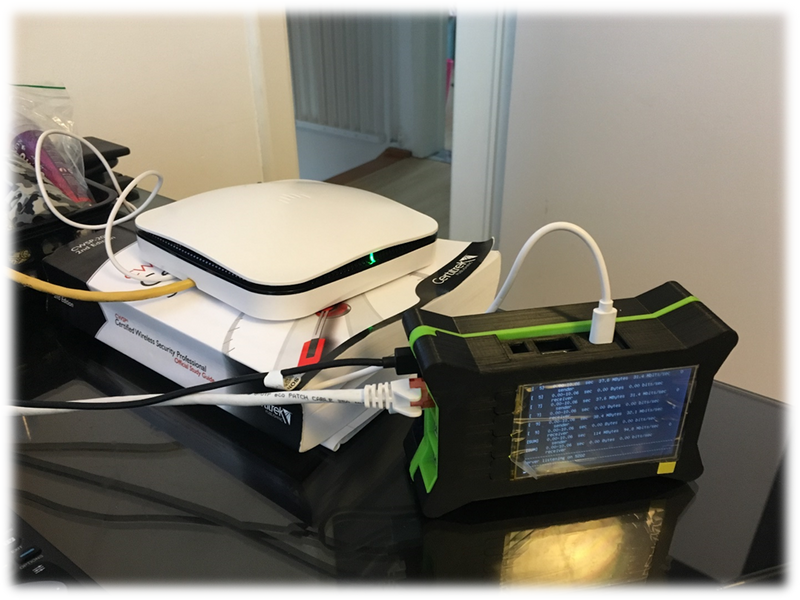
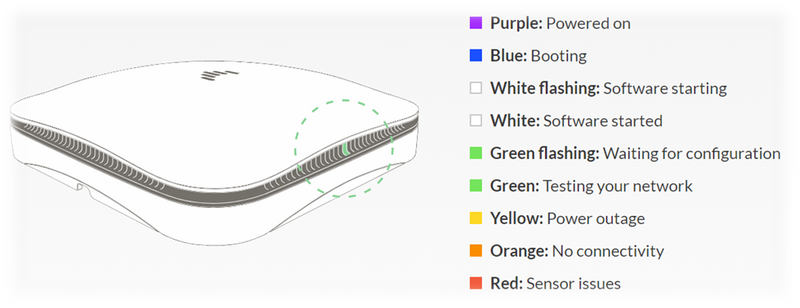
Setting-up the sensor was a breeze, just take it out of the box, plug it into a power outlet (or PoE), connect the UTP cable, the status light turns solid green and you’re done, the device will call home using SSL / 256-bit AES encrypted communications with the cloud servers, so (duh!!!), of course you will need connectivity towards the internet.
Now, for the Dashboard, it is very easy to learn and add sensors, and tests. The main dashboard looks like this, just surf to https://dashboard.capenetworks.com/ and add your sensor.
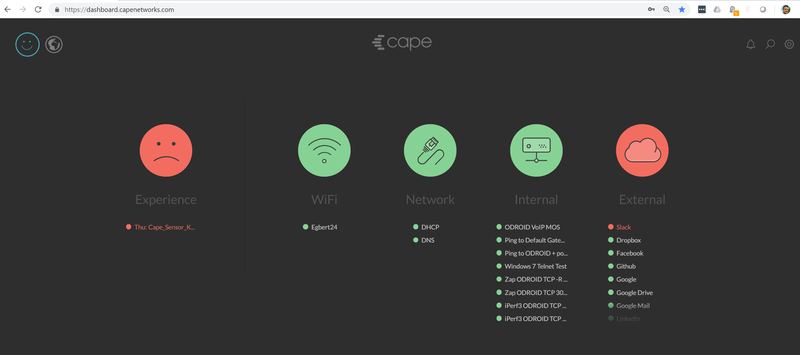
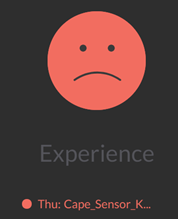
Five traffic lights show the status of:
- Experience: overall user experience
- Wi-Fi: Wi-Fi connectivity and quality
- Network: core network services
- Internal: your most critical internal services, like captive portals
- External: important external services
Now for the colors, there are 4 possibilities:
- Green: the network is good
- Yellow: there is a warning about the network (this is often threshold issues, like high latency, but not excessively so)
- Red: errors, there is a network issue.
- Gray: untested
Smashing, lets set-up some tests and start fooling around. I configured several internal and several external tests and let them run for about 3 hours. First the internal tests:
ICMP Ping to Default Gateway
I am only interested in the last 3 hours, so I configured the dashboard to only show me data during that timestamp.
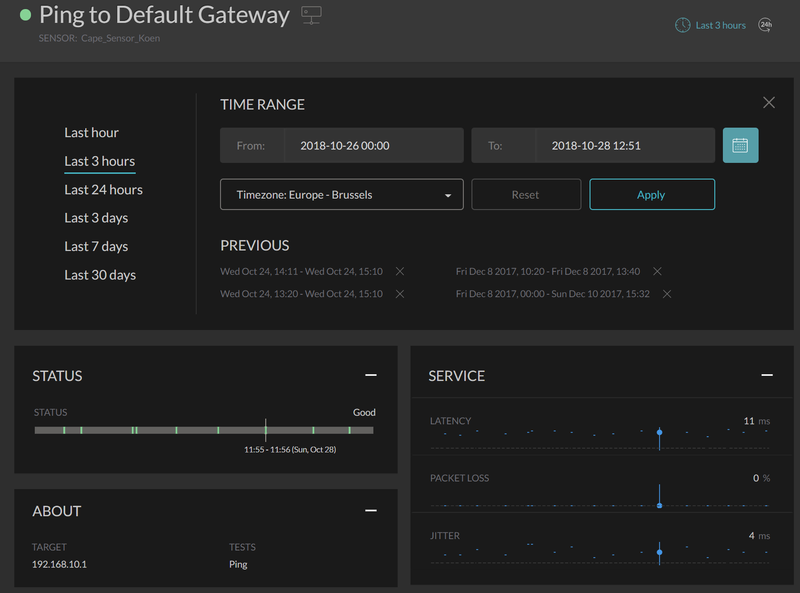
You can see that it ran a ping every 20 minutes for about 1 minute each (green bars). When you hover over the Status bar, you can see details like latency, packet loss and jitter. It is good to know that the sensor runs all tests on both its Wireless and ethernet interface. This is fantastic, because this way when issues pop-up, you can quickly see if it is wireless only related problem, more on this later.
Ping to ODROID + port 5202
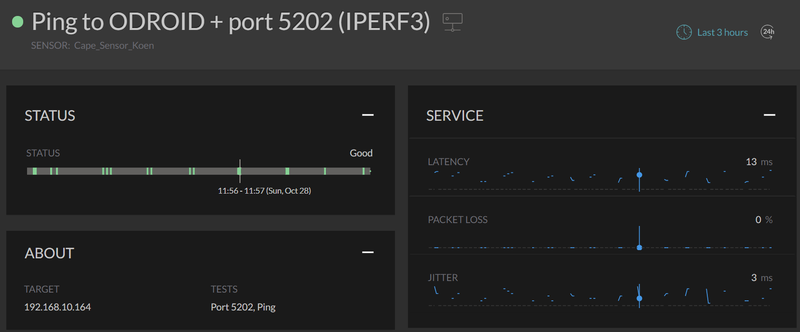
Over here, I am running a normal ping test to my ODROID as well as a port ping to 5202 (this is the port, the ODROID is listening on for IPERF throughput tests, same output as in previous test can be found here. Note that it is displaying the average latency, packet loss and jitter for both ping tests.
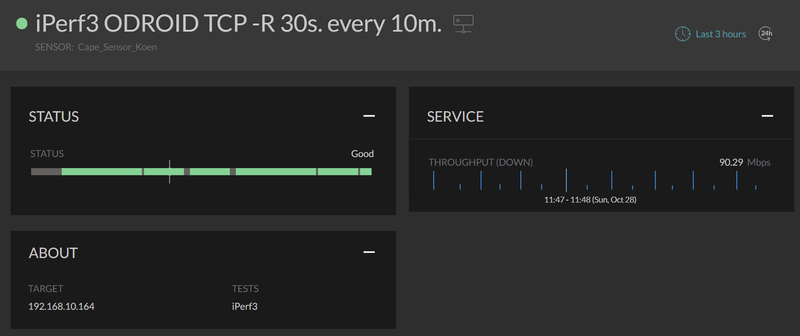
iPerf3 ODROID Upload & Download Throughput Test
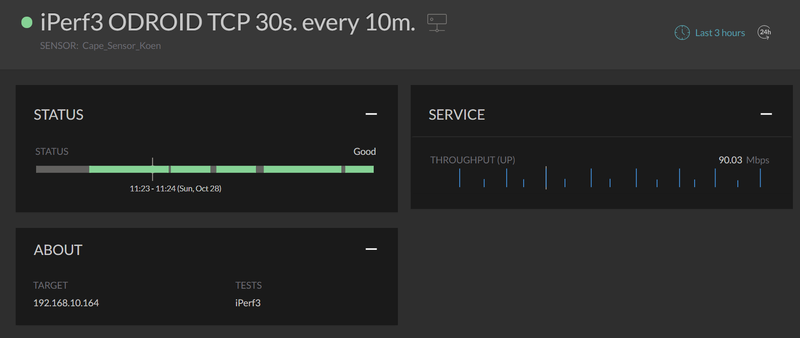
With Iperf3, standard you will run a throughput test towards the server, so upload. If you want to test download speeds, then you need to add the -R in your CLI.
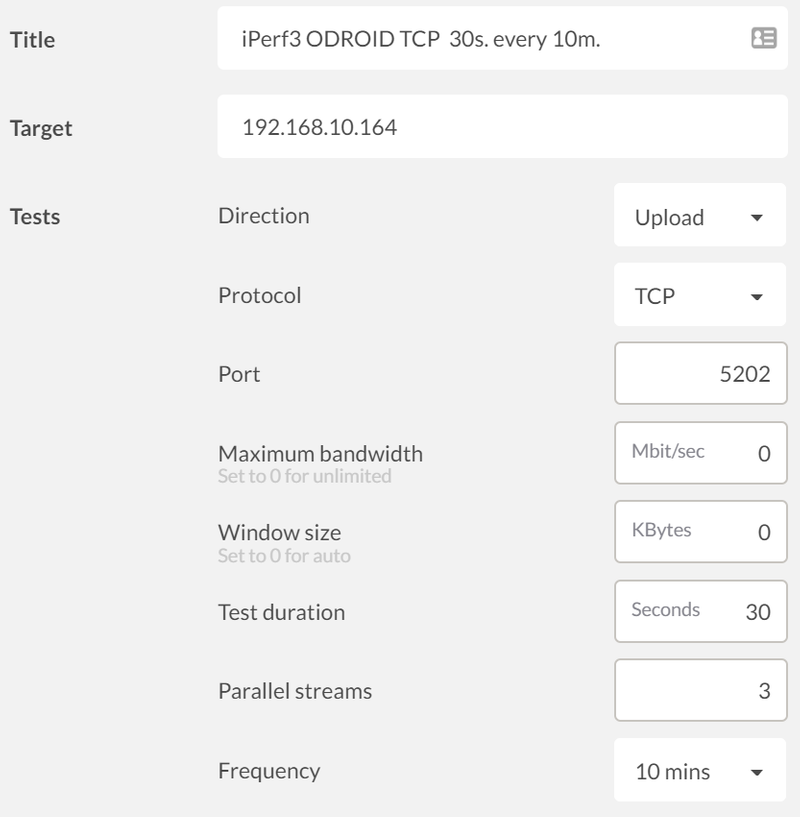
When setting up the test, there is a lot of granularity to choose from like direction, layer 4 protocol, port, test duration, parallel data streams and frequency of testing:
Another thing I noticed is that it switches every 10 minutes between a throughput test over ethernet or over Wi-Fi, so this means that you only run a Wi-Fi test once every 20 minutes. You can see this more clearly under the "Experience" view where you can make a separation between ethernet tests and Wi-Fi tests.
ZAP ODROID Upload & Download Throughput Test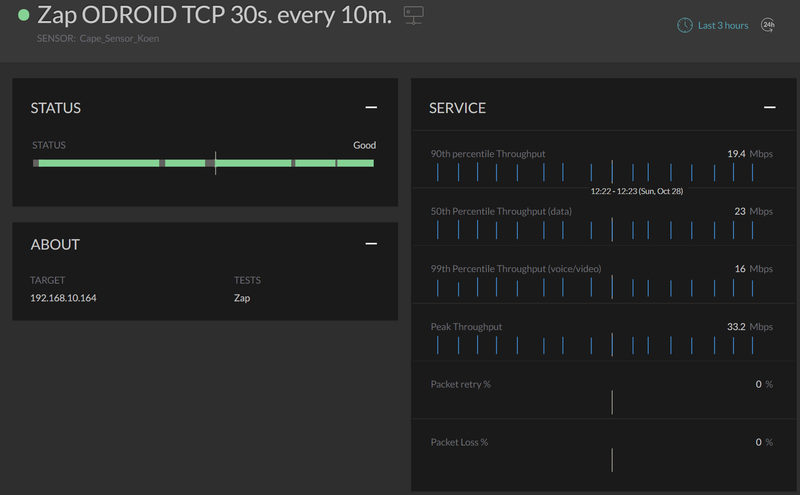
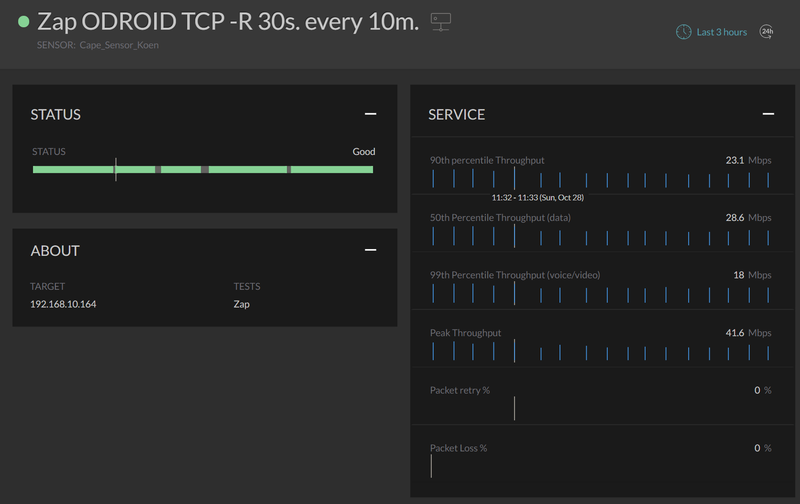
The nice thing about ZAP compared to Iperf3 is that you can see the peak throughput as well as the expected throughput that can be sustained for a percental of time of the test duration.
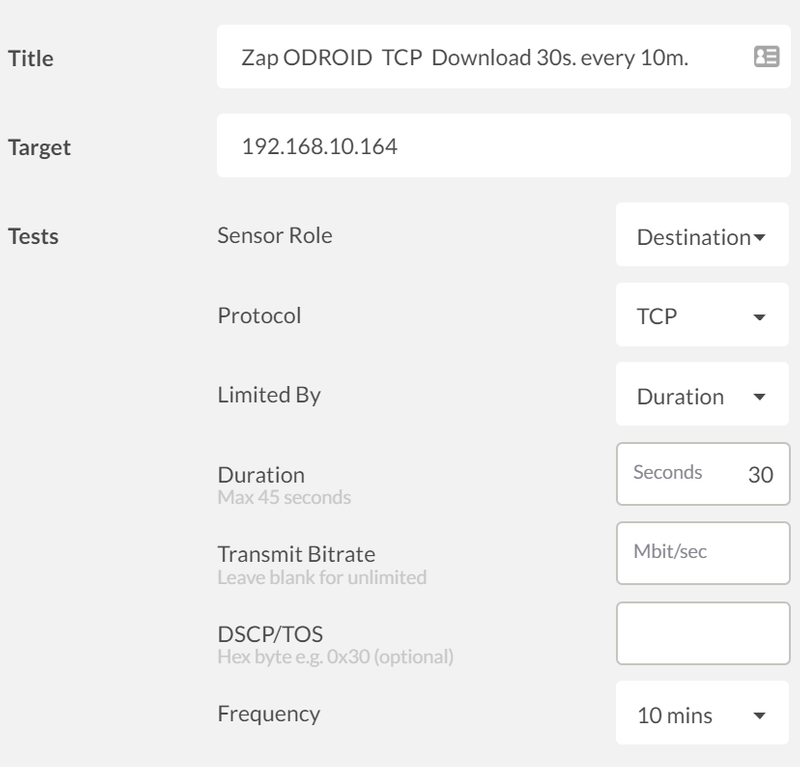
Also, here is a lot of granularity like direction, layer 4 protocol, test duration, QoS markings and frequency of testing:
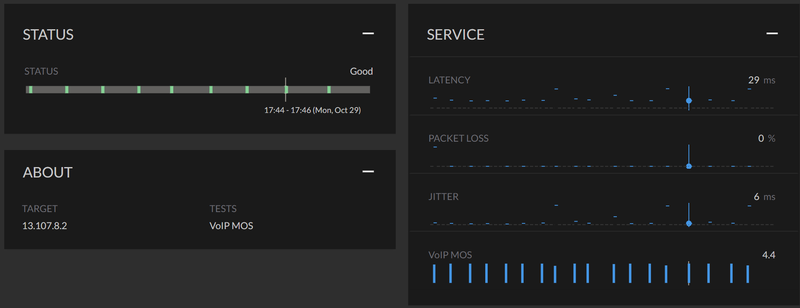
ODROID VoIP MOS Test
Now let’s dig into the latest added tests, first one will give you a MOS (Mean Opinion Score) to grade voice quality, I am running this test towards the ODROID which is not a voice server nor gateway, so it is not actually simulating a voice call but rather a connection test. This test is by default ran on TCP port 443.
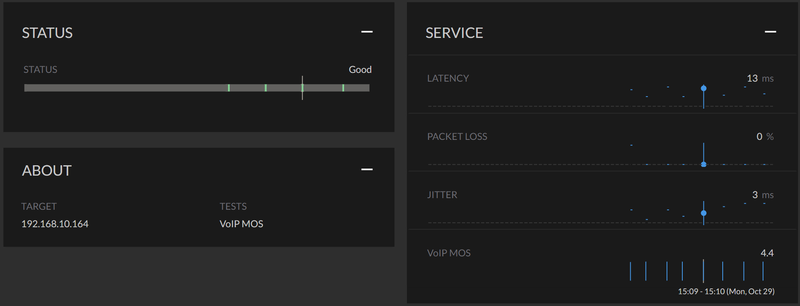
The MOS Formula is based on average Latency, Packet loss and Jitter and is rated like follows by Cape:
4.4: Best score possible
4.3 – 4.4: Users very satisfied
4.0 – 4.3: Most users satisfied
3.6 – 4.0: Some users satisfied
3.1 – 3.6: Many users dissatisfied
2.6 – 3.1: Nearly all users dissatisfied
1.0 – 2.6: Not recommended
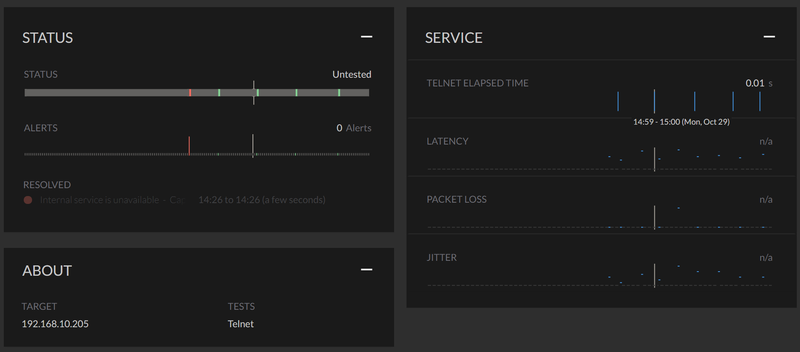
Telnet Test
For this test, I ve set-up my Windows 7 laptop as a Telnet server. This can come in handy If your business runs a mission critical, Telnet based application such as barcode scanners in a warehouse. When configuring this test, you can optionally validate a prompt text on the server (search string). The test will measure and report the success and timing of that process allowing you to get alerted when the service slows down or fails.
That’s all that I did for internal testing, now let’s move on to the external tests. I will group the predefined templates that conduct the same tests.
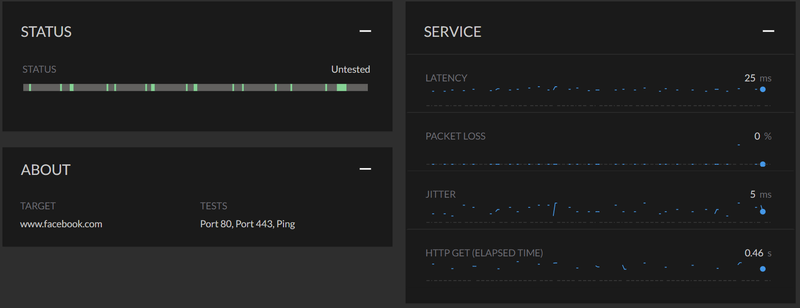
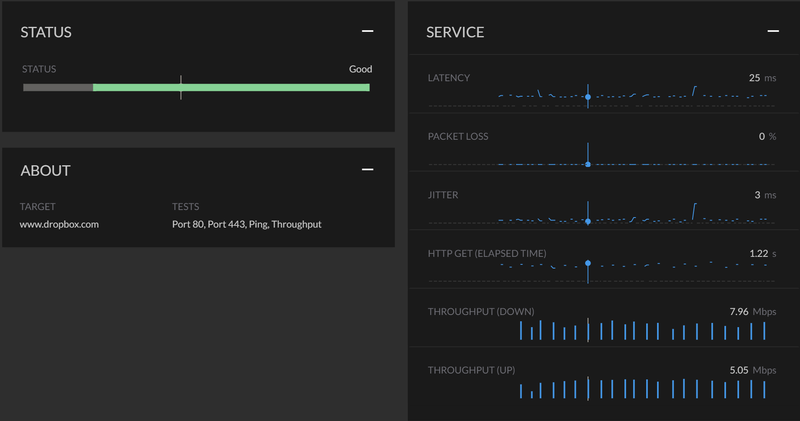
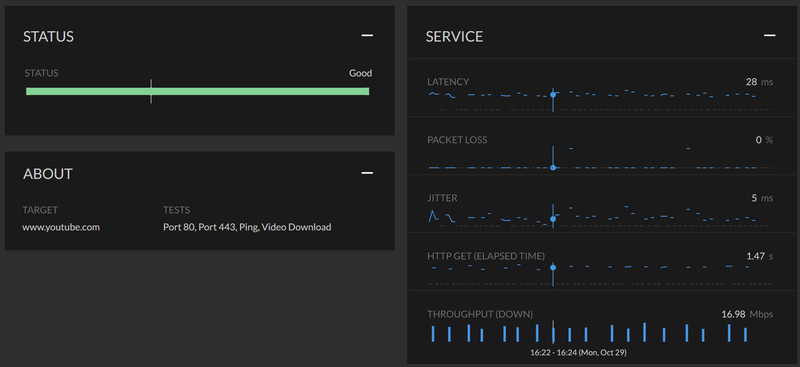
HTTP GET
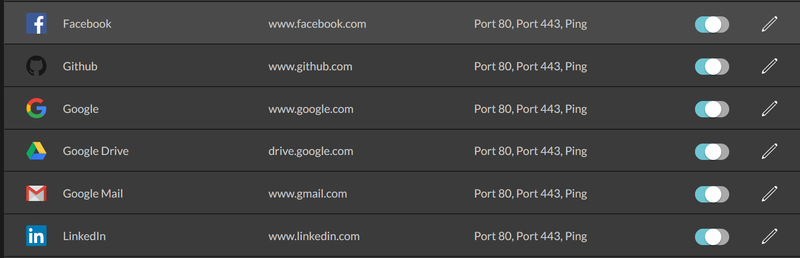
For the sites above, the sensor will resolve their IP address and conduct an ICMP ping test. The sensor will also send the HTTP GET request on both ports 80 and 443 towards the server; then the server returns a response to the client. The average time between the 2 ports to receive this response is displayed under HTTP GET (Elapsed Time).
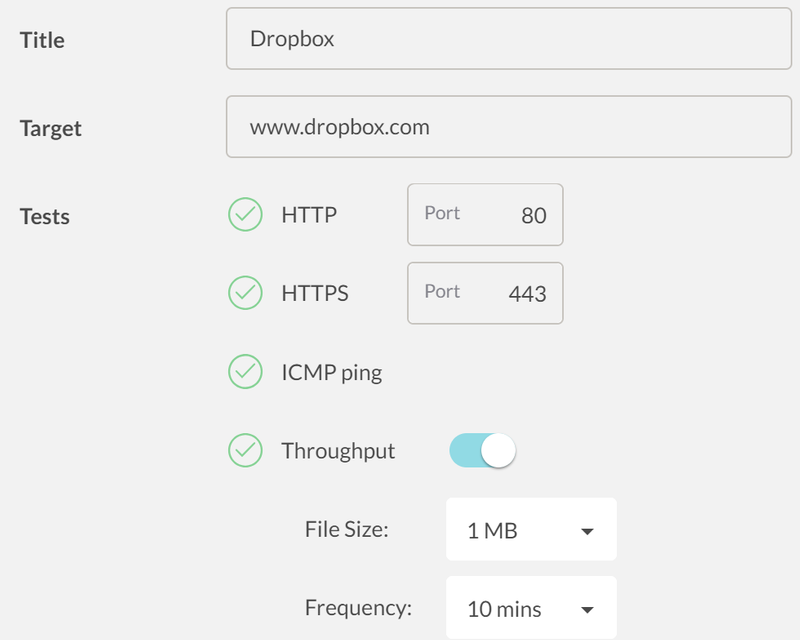
Dropbox
You can upload/download a file to Dropbox using its API for throughput testing of the service. You can select a file size of 1 or 5MB and a test frequency between 10 minutes and 12 hours. The previous mentioned http get/ICMP ping will also run.
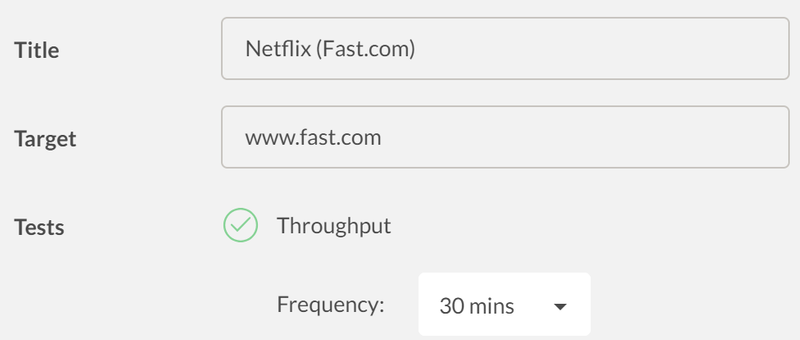
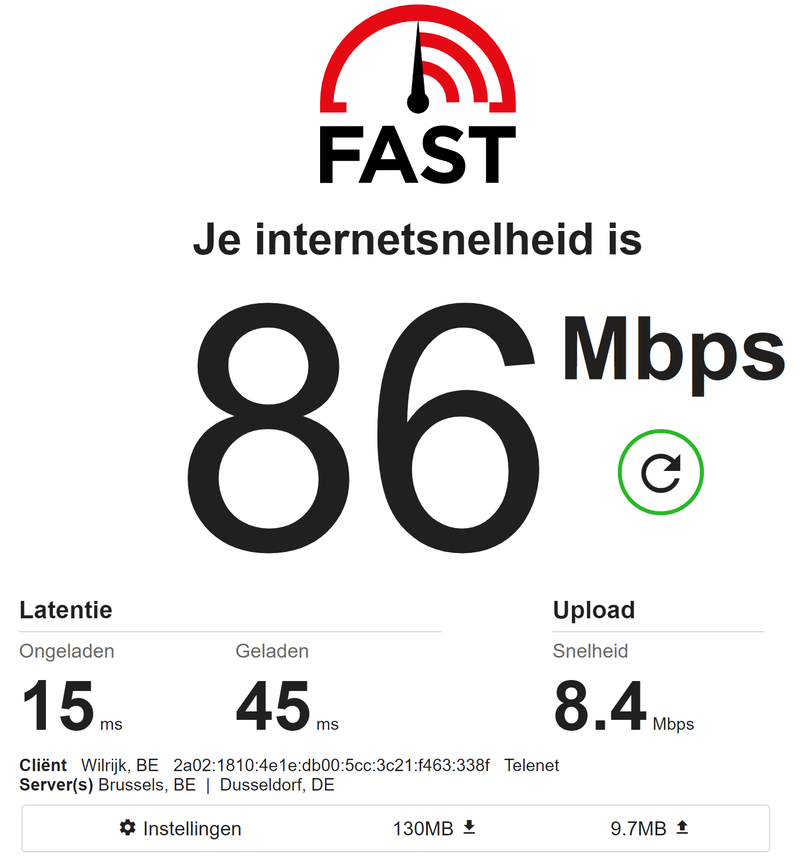
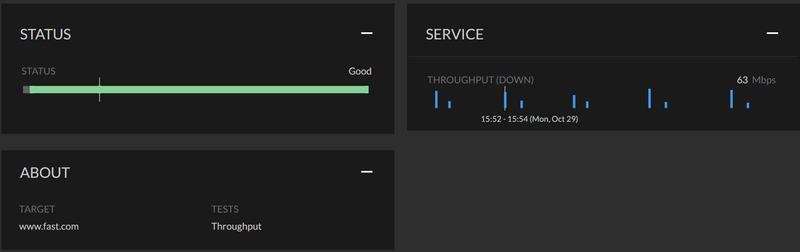
This test allows you to run a Speedtest towards Fast.com, which is hosted by Netflix. You can select a test frequency between 30 minutes and 12 hours. You can also directly from your PC, tablet or phone run a test by surfing to fast.com which will look something like this:
Again, 1 test is run over Wi-Fi and 1 over ethernet, every 10 minutes. Only download Throughput is tested here.
 Netflix recommends the following for download Internet Connection Speeds per video stream:
- 0.5 Megabits per second - Required broadband connection speed
- 1.5 Megabits per second - Recommended broadband connection speed
- 3.0 Megabits per second - Recommended for SD quality
- 5.0 Megabits per second - Recommended for HD quality
- 25 Megabits per second - Recommended for Ultra HD quality
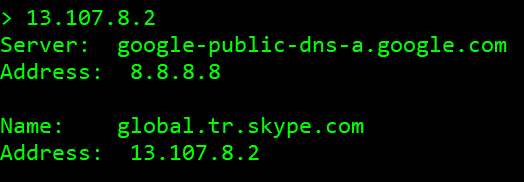
Skype for Business
See the ODROID VoIP MOS Test previous in this blog post. The only difference is that the test will be conducted to the default public IP of 13.107.8.2
YouTube
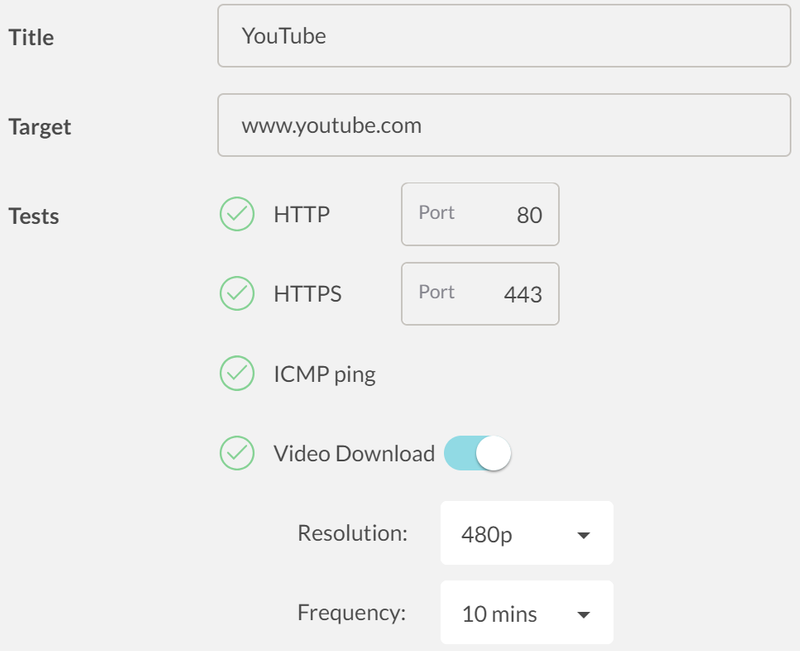
In addition to the familiar pinging and http, you can download a YouTube video from 144p all the way up to 4K resolution (UHD) with a test frequency between every 10 minutes to every 12 hours. So again, this is another type of throughput test, downloading a video from YouTube’s CDN.
According to Google's Video Quality report, you can interpret the throughput measurements in the following manner:
- > 2.5 Mbps, HD streaming: Minimum throughput required to sustain an average YouTube HD video playback at 720p resolution.
- 0.7 to 2.5 Mbps, SD streaming: Minimum throughput required to sustain an average YouTube SD video playback at 360p resolution.
- < 0.7 Mbps, LD streaming: Throughput too low to sustain YouTube SD video playback at 360p resolution.
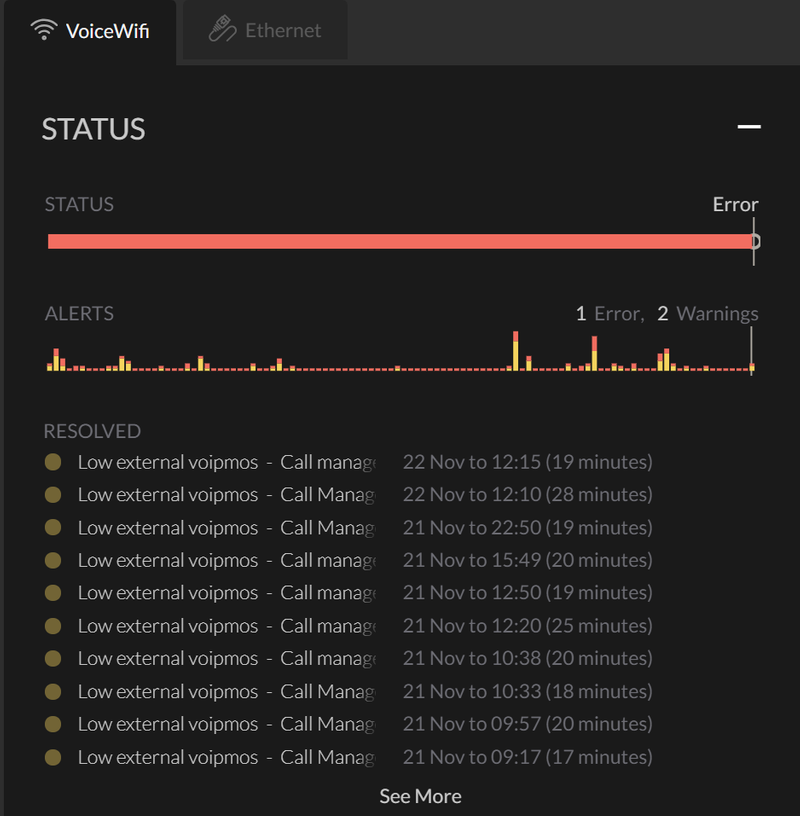
So, what if it all goes wrong?
If alerts are triggered, then you will receive a notification. You can then drill down into the issue, compare it with the correlating ethernet test and even sometimes download a packet capture when the event was triggered to further analyze.
 Vs.
Vs. 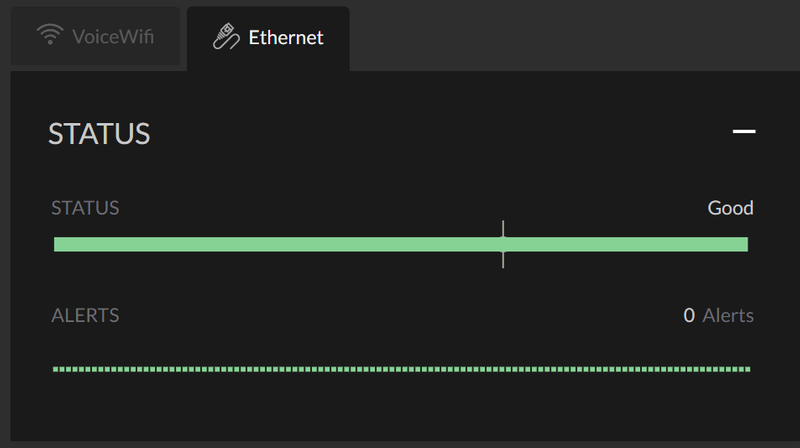
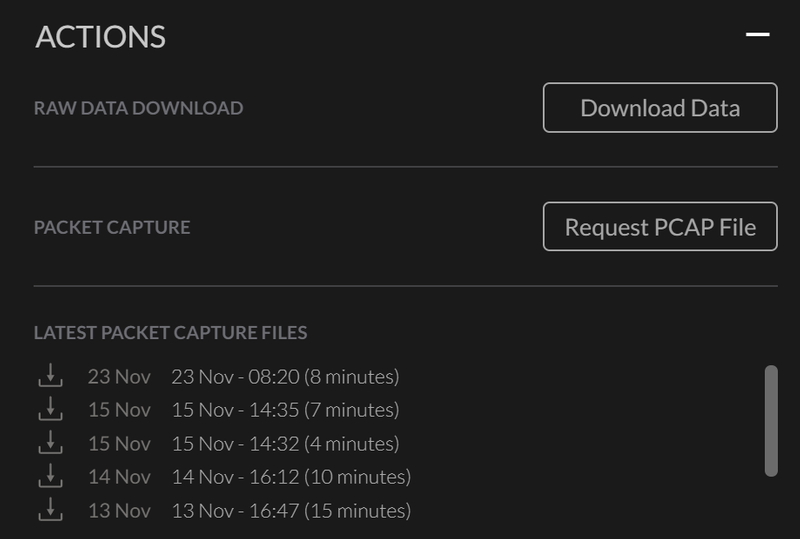
Requesting PCAP File
Requesting a PCAP will instruct the sensor to send through the entire buffer it holds in memory which is 50MB. The PCAP data will be sent as soon as the sensor receives the request for PCAP data. The duration of PCAP data will vary based on the traffic on the network. Less traffic will mean a longer replay duration within the 50MB buffer.
Weekly Reports
You can even configure the system to send you a weekly report showing you Metrics and top alerts for your environment. Here you can again compare your testing WLAN with the correlating ethernet interface tests. The results will also be compared to the previous week should you be testing or monitoring for longer periods.
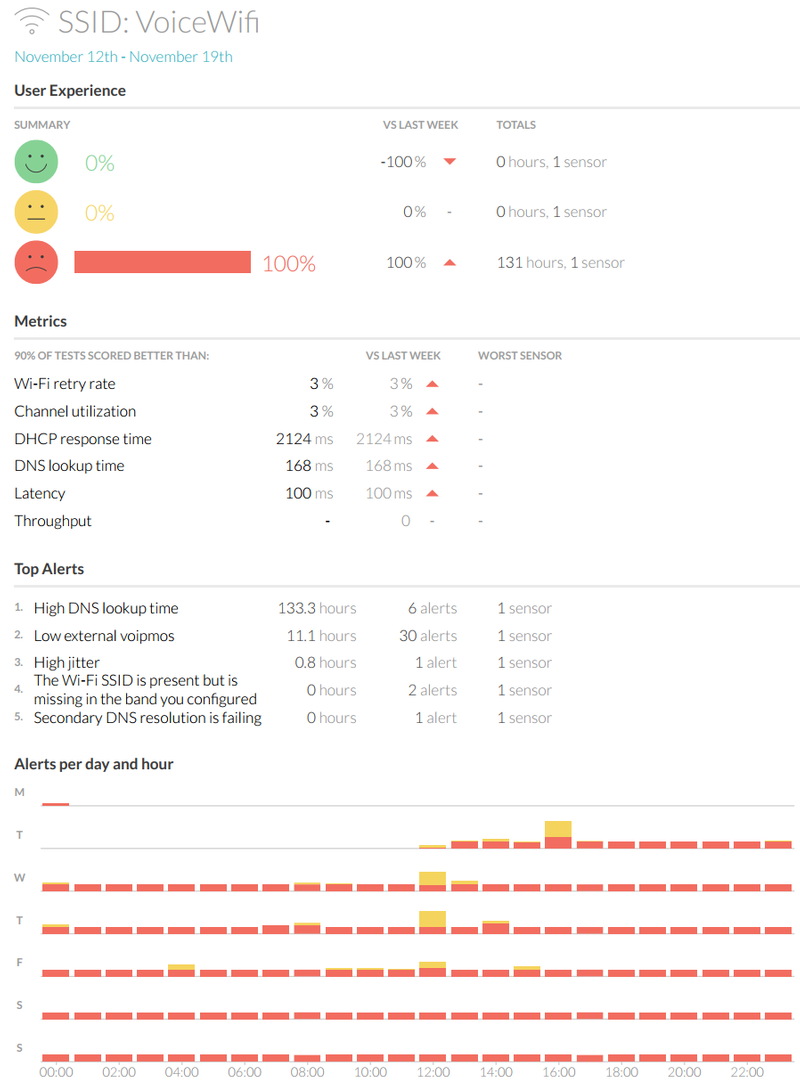 Vs.
Vs. 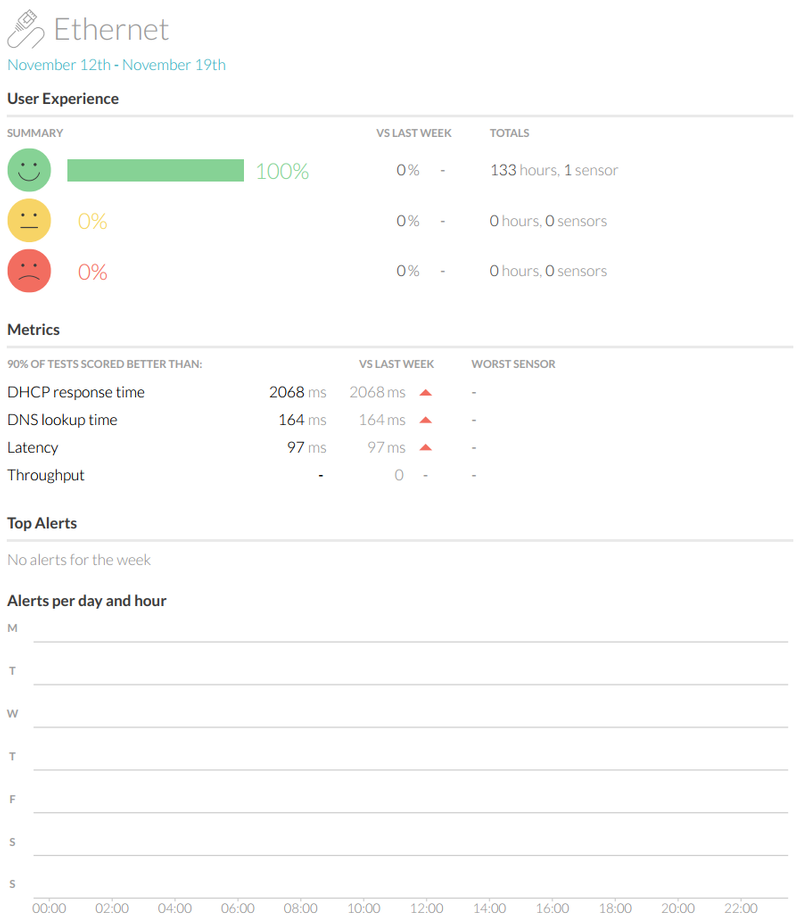
Conclusion
Good tools are so important for the WLAN Professional, the Cape sensor is a cool testing device that I use daily for troubleshooting purposes. It gives me a good sense about the current WLAN environment and the way client devices are experiencing it. However, keep in mind that not all clients are the same and even same devices brands/types running different code can behave very differently. so the takeway here is to always also test with the actual client device in production.
One thing i checked with Aruba is that my sensor is an older 802.11n (5GHz band), so no 802.11ac support. The newer models however should have 802.11ac chipsets.
I thank you all for reading and hope to see you again soon for another blog post.
